Primavera P6 reporting is an essential feature for users who need to share schedule progress updates with stakeholders. It allows project teams to present clear, organized data that reflects real-time project performance.
While users can easily print a PDF version of the activities table and Gantt chart to show project status, stakeholders sometimes prefer a more detailed, tabulated view of schedule progress. With Primavera P6 professional reporting, you can quickly generate professional, tabulated reports that highlight every key aspect of your project’s timeline and progress.
In this article, we’ll walk you through how to create a tabulated schedule progress report using our Primavera P6 reporting tutorial.
What are the Types of Reports In Primavera P6?
Primavera P6 reporting plays a key role in tracking and analyzing project performance. There are several types of reports, each serving a different purpose.
- Tabular reports present project data, such as activities, costs, and resources, in a clear table format, making it easy to review details.
- Graphical reports utilize charts and histograms to display trends, progress, and workload visually.
- Layout reports, also known as printed layouts, display Gantt charts and activity tables directly from the project view.
- Report Wizard helps users create custom reports quickly without requiring technical skills.
- Custom SQL reports allow advanced users to extract complex data and integrate with databases.
Step-by-Step Process of Creating Primavera P6 Reports
Here we’ll guide you through the step-by-step process for creating user-friendly Primavera P6 reports:
- To create a tabulated report, select the Reports icon from the Enterprise tool group.
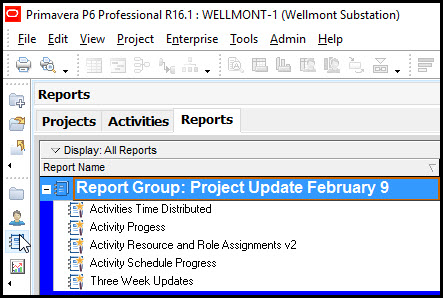
- Once in the Reports window, choose Edit | + Add to launch the Report Wizard.
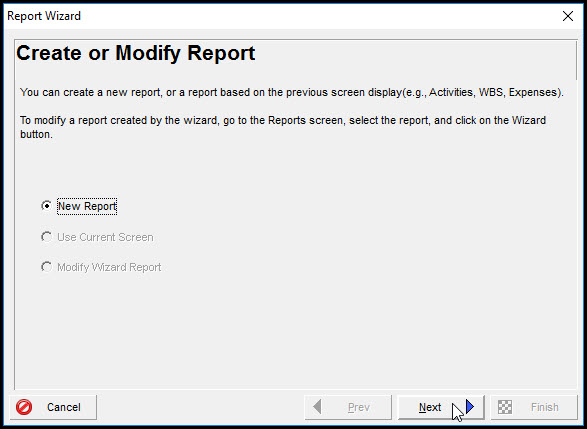
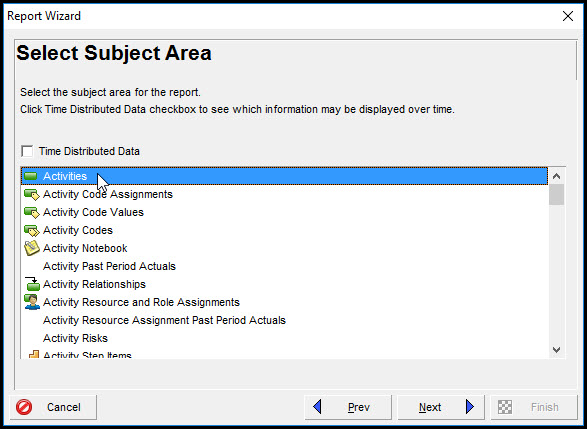
- Click Next, and in the Select Subject Area dialog, choose Activities.
- Next, in the Select Additional Subject Areas window, select Activity Steps.
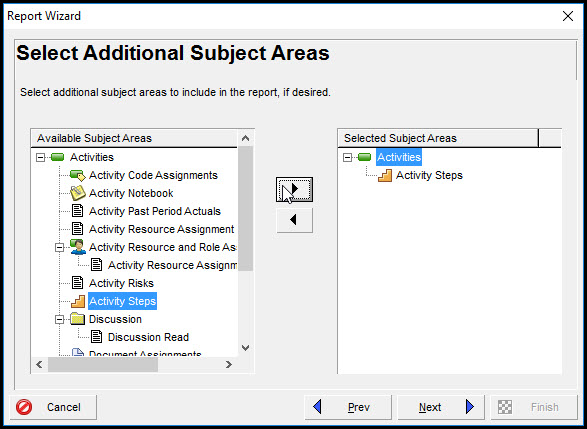
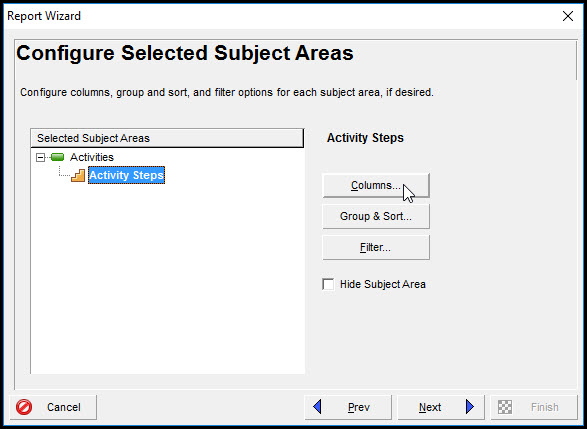
- Since two of our scheduled activities include steps, we’ll configure the report to display their step progress. Move Activity Steps to the Selected Subjects Area frame and click Next to continue to the configuration window.
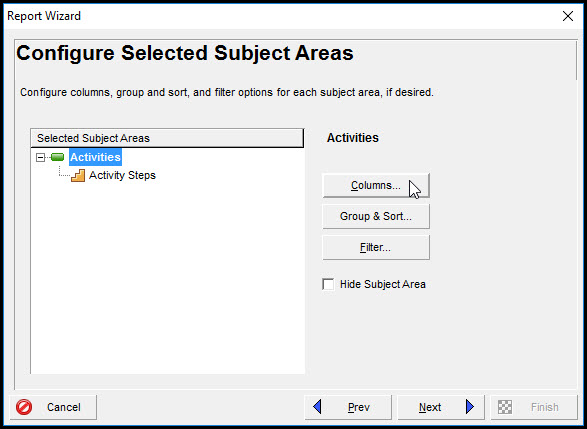
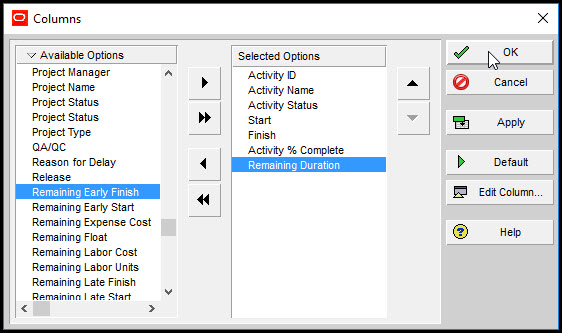
- Highlight Activities, then click Columns to open the familiar Columns dialog.
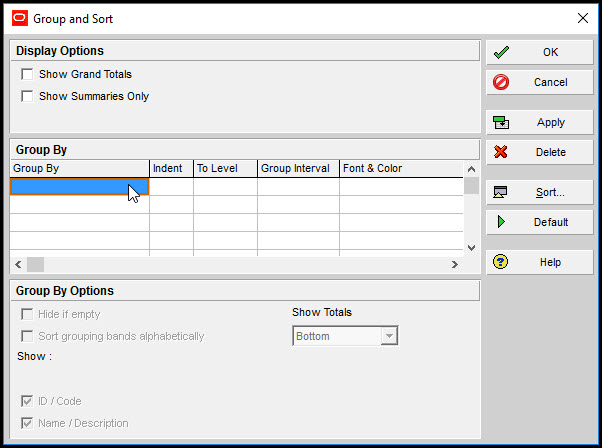
- You don’t need to modify the Group and Sort options, but to confirm that no grouping criteria exist, click Group and Sort.
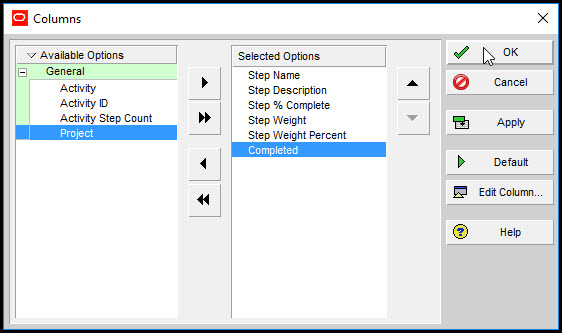
- No filter is necessary for this report, so the activities section is now fully configured. Next, let’s configure the Steps. Highlight Steps and click Columns.
- In the Columns dialog, select all relevant options to display the steps data.
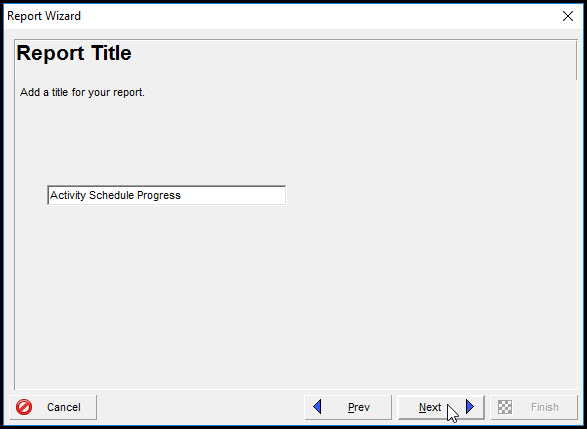
- There’s no need to set up grouping or filters for steps. In Figure 11, we’ve entered a descriptive name for the report.
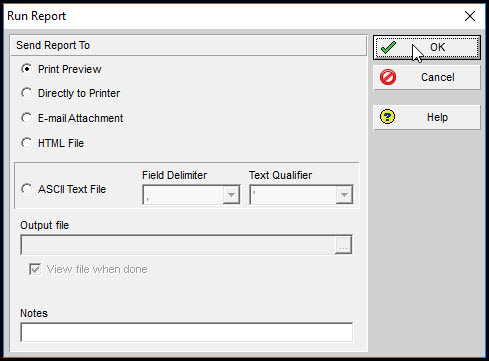
- Click Run Report.
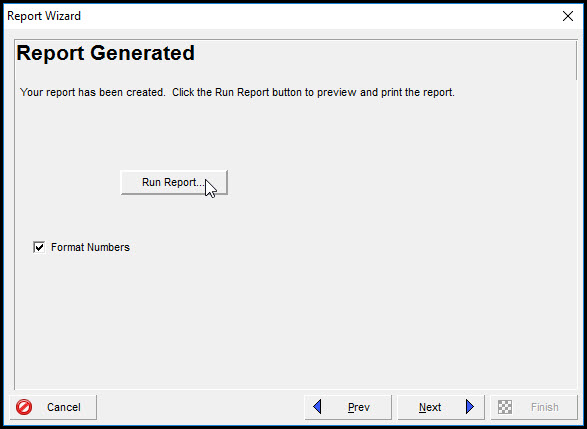
- Enable Print Preview and select OK.
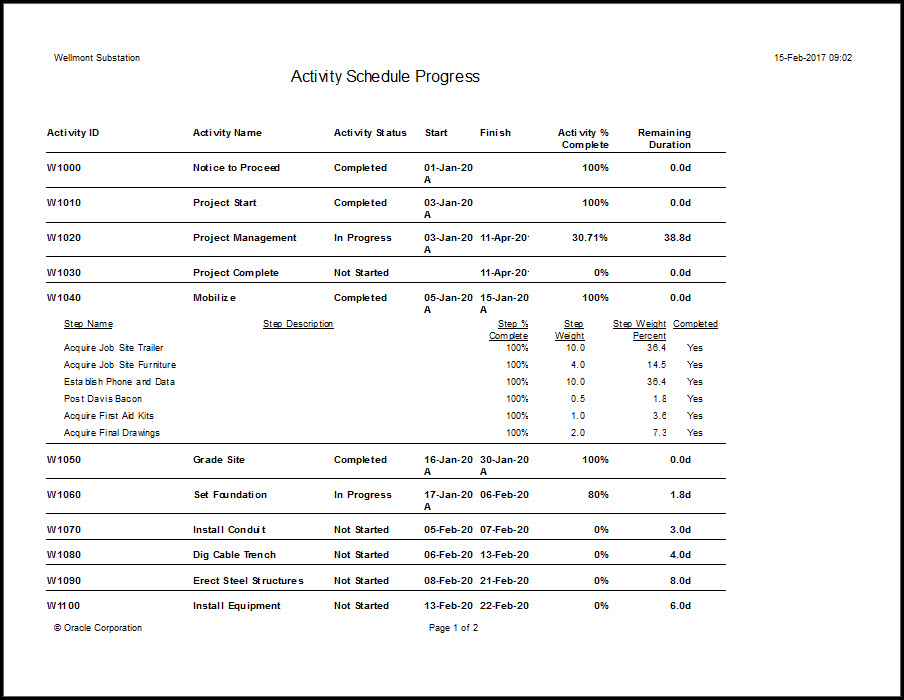
- Your completed tabulated report will appear, as shown in Figures 14 and 15.
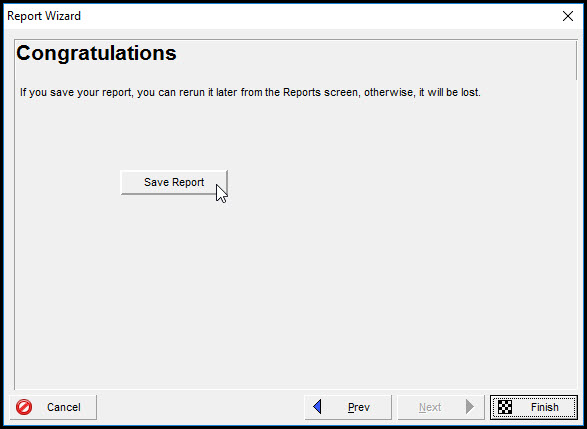
- Once you have reviewed the report and confirmed that everything looks correct, click Save to use the Primavera P6 project report PDF.
Conclusion
Mastering Primavera P6 professional reporting is a key skill for effective project management. It streamlines the creation of structured, tabular reports while providing flexible options to share or store critical project data.
In this guide, we explored the types of reports in Primavera P6 and the step-by-step process of generating organized, tabulated reports that can be customizable according to your project’s needs.
By using these reports efficiently, you can enhance team communication, improve data accuracy, and simplify progress tracking.
Want to Learn More?
Watch our 2-hour free course on Primavera P6 training for oil and gas projects.