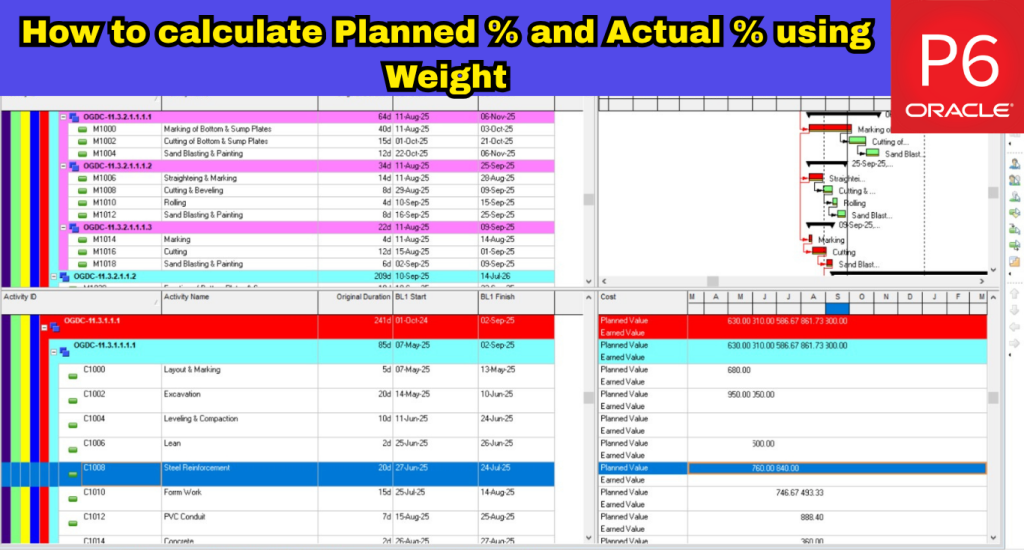
In Primavera P6, understanding Schedule % Complete (also known as Planned %) is essential for tracking whether your project is progressing as intended. This metric compares the current status of your project against the baseline to show how much work should have been completed by a given point in time.
What many users overlook is that Schedule % Complete is calculated using baseline dates and the current Data Date — and when those two dates match (typically at the project start), Schedule % Complete will naturally show zero. As your project advances, this value increases based on planned progress.
But here’s the catch: default calculations don’t account for the varying importance or weight of different activities. To get a more realistic view of progress, especially in complex or milestone-driven projects, calculating Planned % and Actual % using custom weights is a smarter approach.
In this blog, you’ll learn:
- The difference between Schedule % Complete and Physical % Complete
- How to assign weights to activities
- And how to calculate both Planned % and Actual % using those weights — for more accurate and insightful progress tracking
How Schedule % Complete is Calculated in Primavera P6
Primavera P6 calculates Schedule % Complete using time-based progress by default. The formula is:
Create image of this formula:
Schedule % Complete = (Data Date – Baseline Start) / (Baseline Finish – Baseline Start)
This measures how much of the project’s baseline duration has elapsed up to the current data date — giving you a time-driven view of planned progress.
However, when your schedule is cost-loaded, Primavera takes a more value-based approach. In such cases, Schedule % Complete is based on the earned value principle and uses this formula:
Create image of this formula:
Schedule % Complete = Planned Value (PV) / Budget at Completion (BAC)
Where:
- Planned Value (PV) is the portion of the baseline cost expected to be earned up to the data date
- BAC (Budget at Completion) is the total baseline cost of the project
This approach gives a more realistic picture of planned progress by factoring in financial weight rather than just time.
Can You Measure Planned % Using Custom Weights?
Primavera P6 doesn’t natively calculate Planned % Complete using custom activity weights (such as scope complexity, effort, or priority). Its built-in methods rely on time, duration, or cost.
If you want to track Planned % using a custom weight-based model — for example, assigning each activity a numeric weight based on its impact — you’ll need to combine Primavera with Excel. Export your schedule data, apply weight-based formulas externally, and optionally bring the results back into P6 using user-defined fields.
Assigning Weights and Calculating Planned & Actual % Using Primavera P6 and Excel
To accurately calculate Planned % and Actual % using custom weights in Primavera P6, you’ll need to use a mix of features inside P6 and spreadsheet processing in Excel. Below is a detailed walkthrough to help you set this up.
In Primavera P6: Assigning Weights to Activities
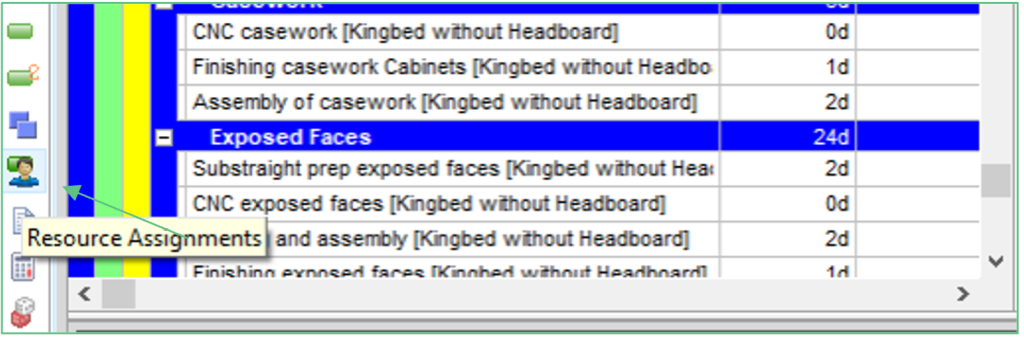
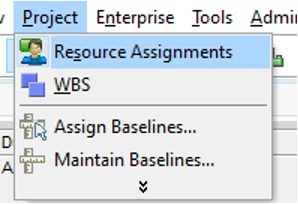
Step 1: Open Resource Assignments
- Open the project you want to work with
- Go to Project > Resource Assignments
- Or click the Resource Assignments icon on the left-hand toolbar
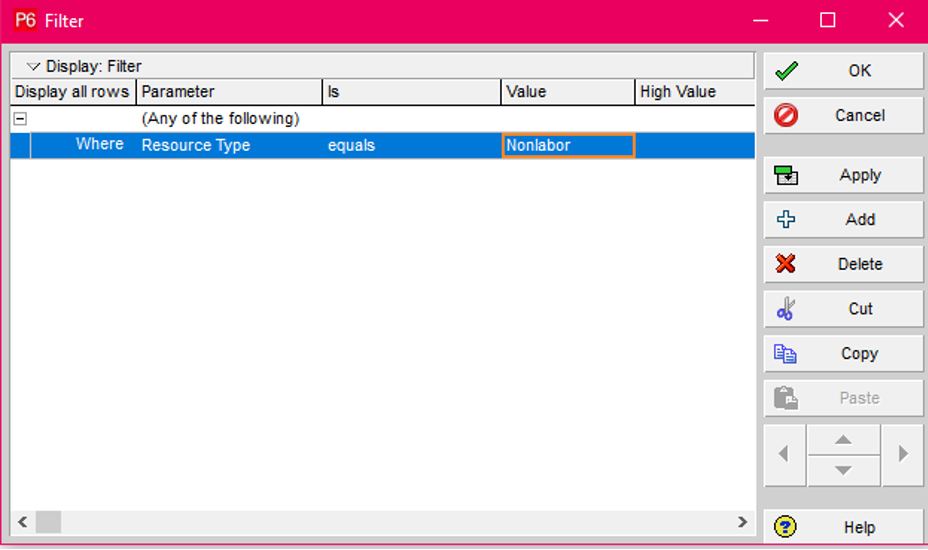
Step 2: Filter by Resource Type
- In the Resource Assignments window, use Filter By to display a specific resource type (e.g., nonlabor)
- This helps isolate the resource used for assigning weights
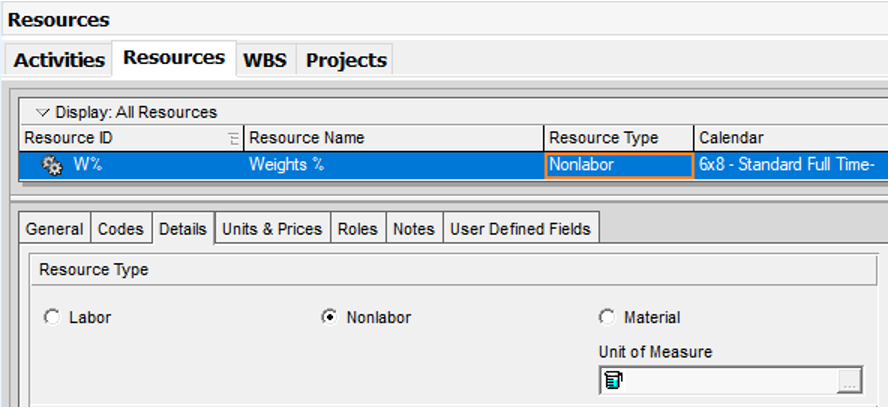
Step 3: Create a Nonlabor Weight Resource
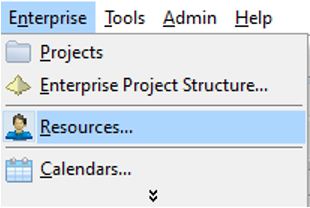
- Navigate to Enterprise > Resources
- Add a new resource and set its Type to Nonlabor
- This resource will serve as the “weight” applied to activities
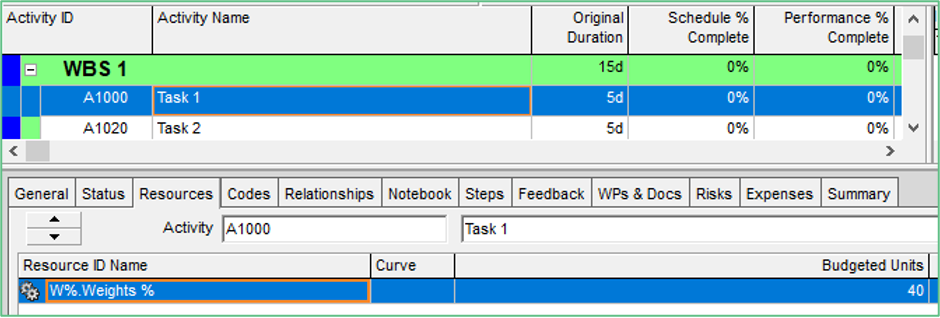
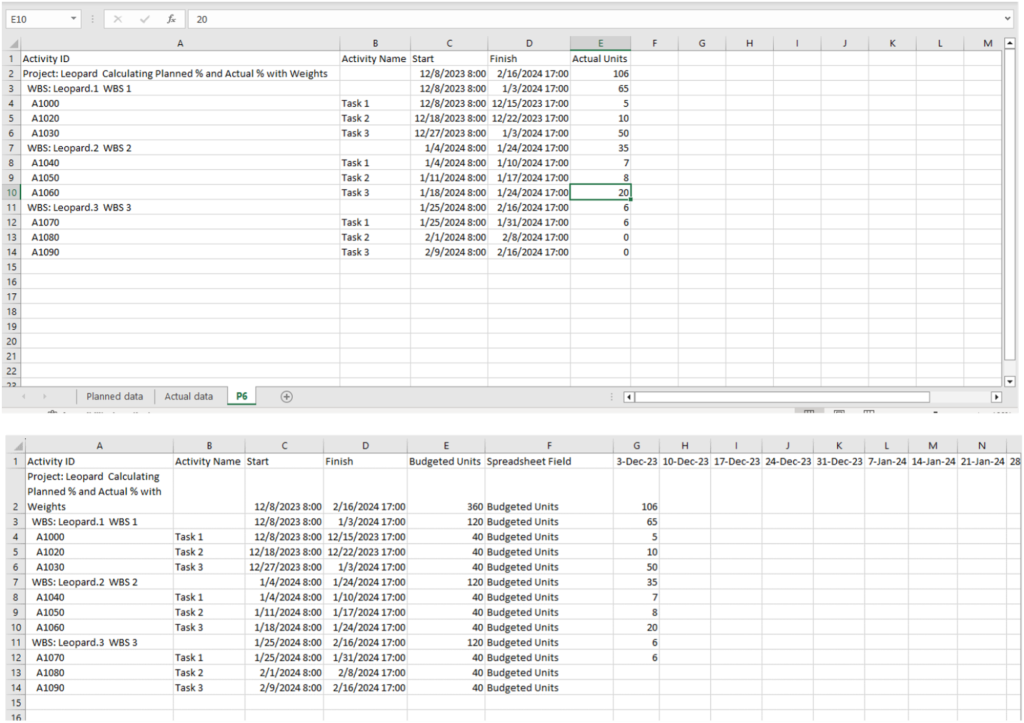
Step 4: Assign Weight Resource to Activities
- Assign this nonlabor resource to each activity
- In the Budgeted Units field, enter a numeric value to represent each activity’s weight
(This value reflects how much each activity contributes to overall project progress)
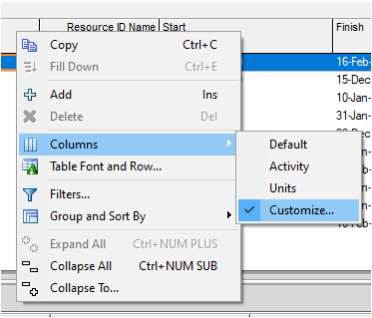
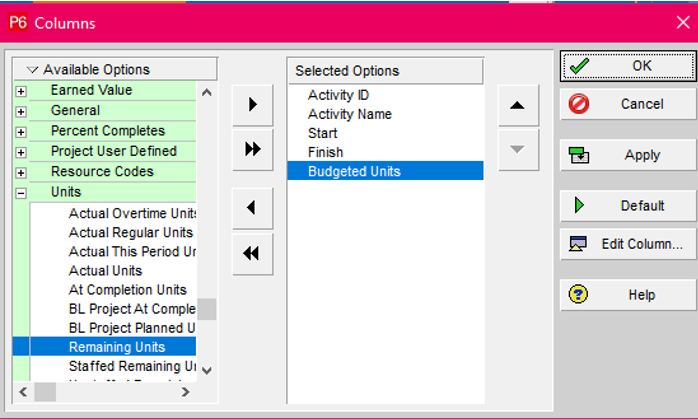
Step 5: Customize the Resource Assignment View
- Reopen Resource Assignments
- Right-click on column headers > choose Columns > Customize
- Add Budgeted Units to the visible columns
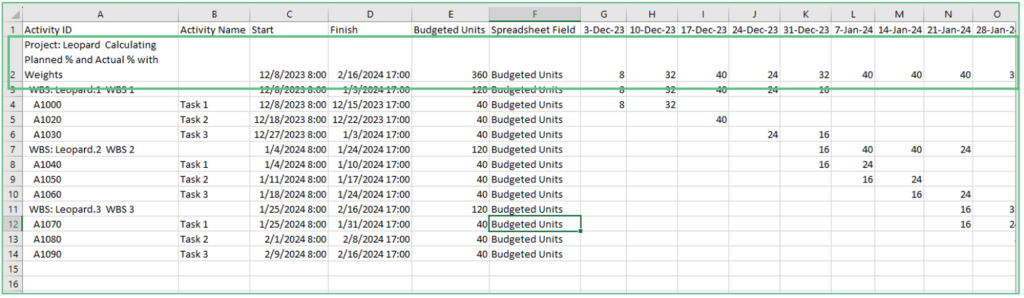
- This displays the assigned weights for each activity
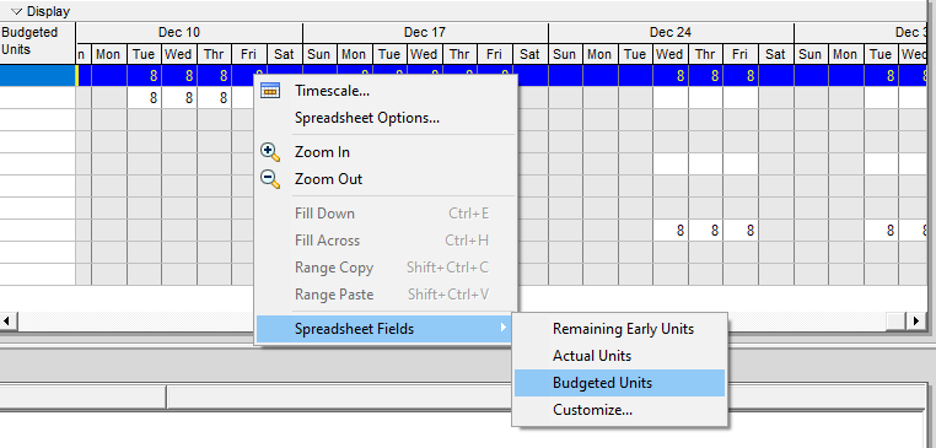
Step 6: Adjust the Spreadsheet Fields in the Chart Area
- In the bottom bar chart/spreadsheet area, right-click > select Spreadsheet Fields > Budgeted Units
- This ensures the bar chart reflects the weights you’ve assigned
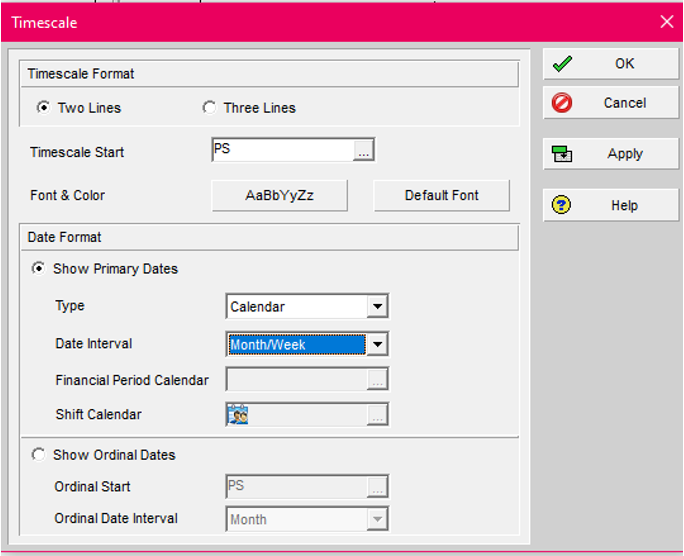
Step 7: Adjust the Time Interval
- Right-click on the time axis and select Timescale
- Change the time period to Month/Week to view data on a weekly basis
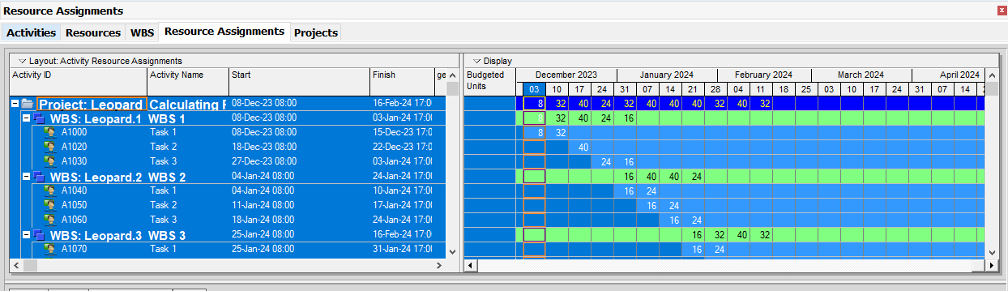
Step 8: Copy the Time-Distributed Data
- Select and copy the resource assignment data (including budgeted units spread over time)
- Paste this data into Excel for further calculation
In Excel: Calculate Planned % Using Weights
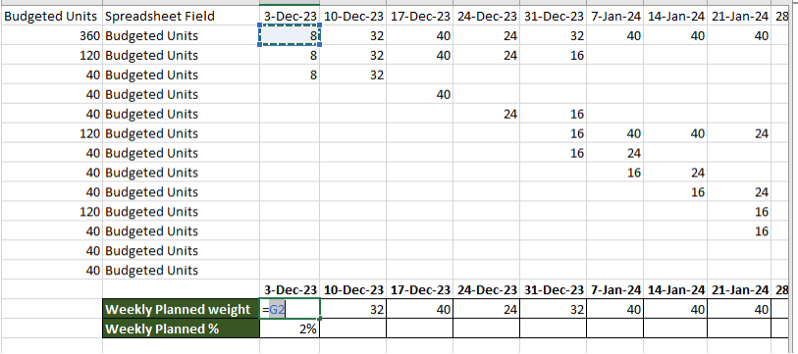
Step 1: Paste Data into Excel
- Paste the time-distributed budgeted units data (copied from Primavera) into a new worksheet in Excel
- This data should include weekly (or monthly) budgeted units for each activity
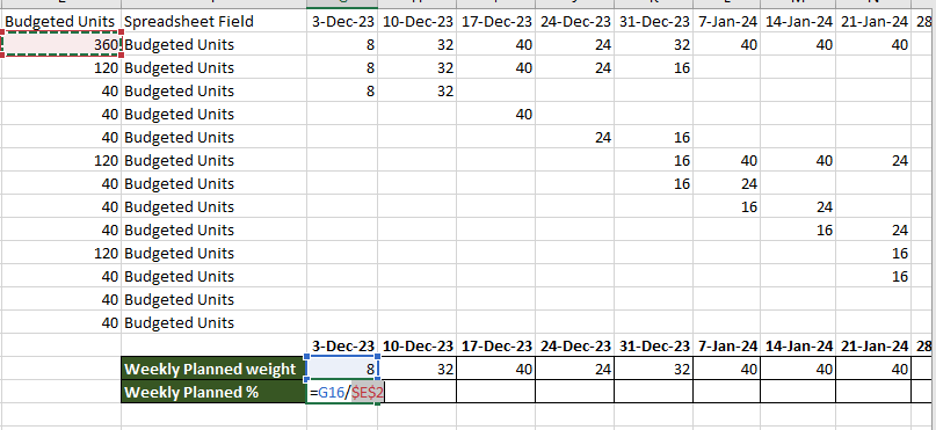
Step 2: Add Weekly Summary Rows
- Create two new rows below your data:
- Weekly Planned Weight — the total of all budgeted units for each week (sum of all rows for that week)
- Weekly Planned % — calculated by dividing the weekly planned weight by the total project weight
Important: In this setup, Row 2 (Weekly Planned Weight) represents the sum of all the activity-level weights (budgeted units) for each week. For example, if you’re looking at cell G2, it should equal the total of all budgeted units in column G for that specific week.
Then calculate the Weekly Planned % using the formula:
Weekly Planned % = Weekly Planned Weight / Total Budgeted Units
This gives you the percentage of planned progress for each time period, based on weight — not just duration or activity count.
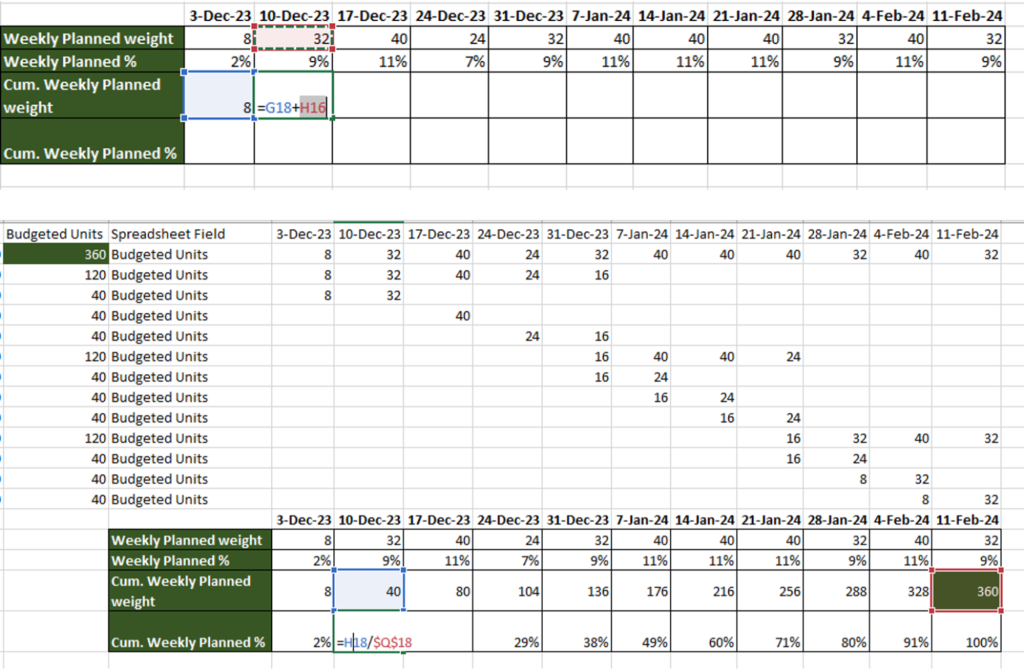
Step 3: Calculate Cumulative Values
- Add two more rows:
- Cumulative Planned Weight — running total of weekly weights
- Cumulative Planned % — running total of weekly planned percentages
- Cumulative Planned Weight — running total of weekly weights
This provides a timeline of how much work should be completed at each point in the project, based on the weight distribution.
In Primavera P6: Track Actual Progress Using Actual Units
Step 1: Replace Budgeted Units with Actual Units
- Go back to Resource Assignments in Primavera
- This time, right-click and change the spreadsheet field from Budgeted Units to Actual Units
Step 2: Export the Actual Units to Excel
- Copy the time-distributed actual units data from Primavera
- Paste it into a new worksheet or a new tab in the existing Excel file
- Create two tabs if needed — one showing actual units only and another combining both budgeted and actual units for comparison
Step 3: Calculate Weekly Actual Units
- To get weekly actuals, subtract the cumulative actual units from the previous week from the current week
Formula Example:
Weekly Actual Units = Actual Units (Week X) – Actual Units (Week X-1)

Step 4: Calculate Weekly and Cumulative Actual %
Add rows for:
- Weekly Actual Weight — the weekly actual units
- Weekly Actual % — Weekly Actual Weight / Total Budgeted Units
- Cumulative Actual Weight — running total of weekly actual weights
- Cumulative Actual % — running total of actual % values
Final Step: Visualize Planned vs Actual Progress
Once you’ve calculated both Planned % and Actual %, create a simple chart in Excel:
- X-axis: Dates (weeks or months)
- Y-axis: Percentage
- Data Series:
- Cumulative Planned %
- Cumulative Actual %
- Cumulative Planned %
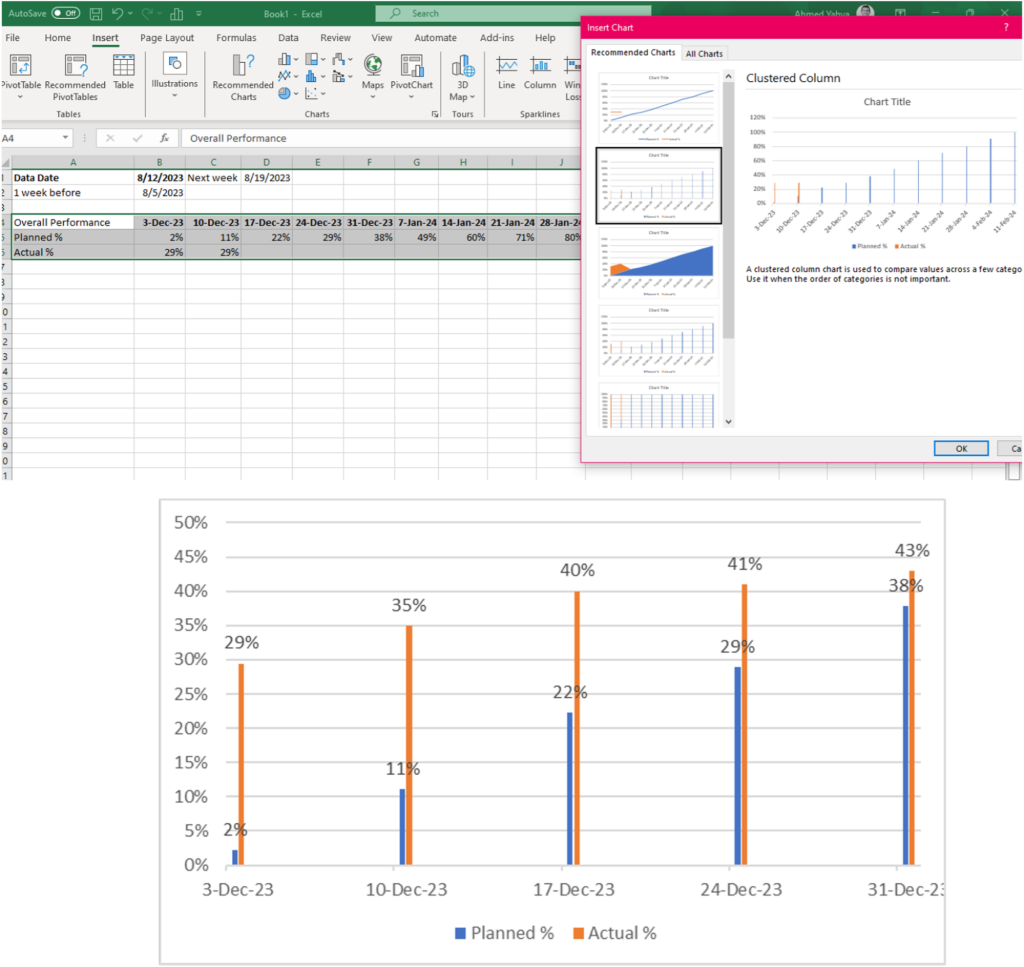
This chart gives a clear visual comparison between where the project should be and where it actually is — using your custom weight-based logic.
